………………………………………………………………………………………………………………………………………………………………………………………………………………………………………….
US Rail Delays
………………………………………………………………………………………………………………………………………………………………………………………………………………………………………….
BNSF Railway is experiencing a series of localized and network-wide delays in June 2026, primarily driven by severe Midwest thunderstorms, recent derailments (including incidents along the Southern Transcon and Panhandle subdivisions), and heavy summer track maintenance.
Key BNSF Network Disruptions
- Southern Transcon: Severe storms and tornadic winds caused temporary track outages near the Chillicothe Subdivision. While reopened, residual delays and network rebalancing continue.
- Panhandle Subdivision: Recent derailments near Danville, KS, and Woodward, OK, have required line closures and rerouting.
- Weather & Maintenance: Heavy rainfall in the Gulf Coast, persistent heat in the Southwest, and track expansion projects (such as at the Winslow, AZ, yard) are contributing to localized congestion.
Upcoming Holiday Impacts
- Independence Day: BNSF has issued a holiday operating plan spanning July 4 to July 6. Shippers should expect approximately 24-hour delays during this window as traffic volumes drop and connections are consolidated.
Rail freight delays on the Union Pacific (UP) and broader U.S. rail networks are currently moderate. Freight volumes are elevated, putting a strain on network capacity. Minor transit delays are expected due to ongoing track maintenance, heat-related speed restrictions, and upcoming Independence Day scheduling adjustments.
Current Rail Delay Factors & Highlights
- Holiday Schedule Adjustments: UP has announced its Fourth of July Holiday Plan, meaning shipments may experience slight delays at terminals or interchanges due to train consolidations and lighter staffing volumes.
- Summer Heat Restrictions: High ambient temperatures across various regions of the country can cause tracks to expand, prompting mandatory heat-related slow orders to ensure safe operations.
- High Freight Traffic: According to the Association of American Railroads (AAR), U.S. rail traffic has shown consecutive weeks of solid volume increases (up nearly 7.8% year-over-year in early June), resulting in tighter network capacity.
- Amtrak/UP Operations: Long-distance passenger operations (such as the Sunset Limited) have faced historical dispatching and track interference bottlenecks, but Amtrak and UP have settled a number of these historical performance disputes to improve on-time metrics.
………………………………………………………………………………………………………………………………………………………………………………………………………………………………………….

………………………………………………………………………………………………………………………………………………………………………………………………………………………………………….
CSMS # 69127837 – UPDATE – Consolidated Administration and Processing of Entries (CAPE) for IEEPA Refunds – Warehouse Entries
………………………………………………………………………………………………………………………………………………………………………………………………………………………………………….

On April 20, 2026, U.S. Customs and Border Protection (CBP) launched the first phase of the Consolidated Administration and Processing of Entries (CAPE) tool in the Automated Commercial Environment to process refunds of International Emergency Economic Powers Act (IEEPA) duties. The purpose of this message is to provide updated guidance on warehouse entries and warehouse withdrawals filed on CAPE Declarations.
GUIDANCE
Warehouse Entry Types and CAPE
Effective July 7, 2026, warehouse entries (Entry Types 21 and 22) will no longer be accepted on a CAPE Declaration. Warehouse entries that are submitted on a CAPE declaration will be rejected with the existing ENTRY TYPE NOT ALLOWED error message.
Warehouse withdrawals (Entry Types 31, 32, 34, 38) will continue to be accepted on CAPE Declarations since the IEEPA duties were paid on the warehouse withdrawals. CBP will process approved IEEPA refunds on warehouse withdrawals submitted via CAPE Declarations upon the (re)liquidation of the associated warehouse entry. The liquidation process for warehouse entries will continue to be performed by CBP in the normal course after all withdrawals have been made and the warehouse entries are ready for liquidation, at which time CBP will process approved refunds of the IEEPA duties.
Warehouse entries (Entry Type 21 or 22) accepted on a CAPE declaration from April 20, 2026, through July 6, 2026, without the submission of the corresponding warehouse withdrawal(s) will not be (re)liquidated with a refund of IEEPA duties. In such circumstances, filers will need to submit another CAPE Declaration(s) with the warehouse withdrawals on which IEEPA duties were paid.
CBP will provide additional guidance to the trade community through CSMS messages as appropriate.
If you encounter any errors in filing an entry summary, contact your CBP client representative or the ACE Help Desk.
Questions regarding this message should be directed to CBP’s Office of Trade Relations at traderelations@cbp.dhs.gov.
Related Message Number(s): 68340863
………………………………………………………………………………………………………………………………………………………………………………………………………………………………………….

………………………………………………………………………………………………………………………………………………………………………………………………………………………………………….

Dear Port of Boston Customers,
The Massport Maritime Department is pleased to announce the renewal of the Container Incentive Program(s) for customers of Conley Container Terminal for FY2027. For full details on the updated programs and eligibility requirements, please click here to view the official letter.
We are also accepting submissions for the FY2026 Incentive Program, with a deadline of September 4, 2026. To apply, you can find all the necessary documents in the Terminal Tool Kit under Container Incentive Program.
If you have any questions about this program, please feel free to reach out to the Maritime Business Development team. Thank you again for your continued support and commitment to Conley Container Terminal.
Andrea Romero
Maritime Trade Lane Development Manager
Mobile: 781-823-9956
Fritz Sanzone
Deputy Port Director, Finance
Office: 617-478-6916
Mobile: 781-426-5366
………………………………………………………………………………………………………………………………………………………………………………………………………………………………………….

………………………………………………………………………………………………………………………………………………………………………………………………………………………………………….
CSMS # 69066837 – DEPLOYED – Consolidated Administration and Processing of Entries
(CAPE) for IEEPA Refunds – Entries Flagged for Reconciliation
………………………………………………………………………………………………………………………………………………………………………………………………………………………………………….
U.S. Customs and Border Protection (CBP) has completed the successful deployment for enhancements to the Consolidated Administration and Processing of Entries (CAPE) application in the Automated Commercial Environment Secure Data Portal (ACE Portal). Importers and authorized customs brokers can now include in their CAPE declarations, submitted in the ACE Portal, entries flagged for reconciliation (entry types 01, 02, 06) for which the reconciliation entry (entry type 09) has not been filed. Consistent with CAPE Phase 1, the entries flagged for reconciliation will be limited to unliquidated entries and entries that have been liquidated within 80 days of the CAPE declaration filing date.
As a reminder, all filing and processing requirements from the first phase of CAPE remain in effect. For detailed information, please see CSMS # 68340863 – UPDATE – Consolidated Administration and Processing of Entries (CAPE) for IEEPA Refunds, April 20, 2026, Deployment
If you encounter any errors in filing a CAPE declaration, contact your CBP client representative or the ACE Help Desk.
Questions regarding this message should be directed to CBP at IEEPAREFUNDS@cbp.dhs.gov.
………………………………………………………………………………………………………………………………………………………………………………………………………………………………………….

………………………………………………………………………………………………………………………………………………………………………………………………………………………………………….
CSMS # 69056483 – Update to Entry-Level Validations for CAPE Declarations
………………………………………………………………………………………………………………………………………………………………………………………………………………………………………….
U.S. Customs and Border Protection (CBP) has updated certain validations performed on entries included on Consolidated Administration and Processing of Entries (CAPE) Declarations filed in the Automated Commercial Environment (ACE).
Entries that previously resulted in the following error messages should be resubmitted on a new CAPE Declaration.
GOODS VALUE AMOUNT MUST BE REPORTED ON THE CH 1-97. The validation resulting in this error message has been removed. Entries that previously triggered this error will now be accepted.
HTS RELATIONSHIP/SEQUENCE MISMATCH. The error message has been broken out into two, more specific, error messages, and the underlying validation has been narrowed to no longer exclude certain valid entries. Entries that previously triggered this error message will now be accepted, or they may result in one of the following new error messages.
- INVALID HTS – This error message results when the line action date is not within the “begin” and “end” dates of the Harmonized Tariff Schedule (HTS) codes on the entry.
- Guidance: If the HTS code has been end-dated and replaced with a new HTS code since the entry summary was originally filed, submit a Post-Summary Correction (PSC) for the entry to remove the expired HTS code and replace it with the new, replacement HTS code. Once the PSC has been successfully processed, resubmit the entry on a new CAPE declaration. Filers needing technical assistance with filing the PSC should contact their assigned client representative for this or other errors.
- HTS RELATIONSHIP MISMATCH – This error message results when an HTS code designated as an add/replace/derived HTS code (an HTS code with an associated range of HTS codes required for duty calculation) exists on the entry, but the corresponding HTS code has not been provided.
- Guidance: File a PSC to provide the appropriate corresponding HTS code(s). Once the PSC has been successfully processed, resubmit the entry on a new CAPE declaration. Filers needing technical assistance with filing the PSC should contact their assigned client representative for this or other errors.
A complete list and descriptions of CAPE validation error messages is available at the International Emergency Economic Powers Act (IEEPA) Duty Refunds webpage and the CAPE Declarations and Error Definitions Quick Reference Guide.
Technical questions regarding this message should be directed to IEEPARefunds@cbp.dhs.gov. ACE technical questions should be directed to the ACE Account Service Desk (ASD) at 866-530-4172 or ace.support@cbp.dhs.gov.
Related Message Number(s): 68396594, 68315804, 68340863
………………………………………………………………………………………………………………………………………………………………………………………………………………………………………….

………………………………………………………………………………………………………………………………………………………………………………………………………………………………………….
CSMS # 69035485 – UPDATE – Consolidated Administration and Processing of Entries
(CAPE) for IEEPA Refunds – Entries Flagged for Reconciliation
………………………………………………………………………………………………………………………………………………………………………………………………………………………………………….
On April 20, 2026, U.S. Customs and Border Protection (CBP) launched the first phase of the Consolidated Administration and Processing of Entries (CAPE) tool in the Automated Commercial Environment to process refunds of International Emergency Economic Powers Act (IEEPA) duties. The purpose of this message is to provide updated guidance on the availability as of June 29, 2026, of new functionality for CAPE that provides for the acceptance of entries flagged for reconciliation with no reconciliation entry on file.
GUIDANCE
Entries Flagged for Reconciliation with No Reconciliation on File
All filing and processing requirements from the first phase of CAPE remain in effect. For detailed information, please see CSMS # 68340863 – UPDATE – Consolidated Administration and Processing of Entries (CAPE) for IEEPA Refunds, April 20, 2026, Deployment. Effective June 29, 2026, CAPE will accept entries flagged for reconciliation (entry types 01, 02, 06) for which the reconciliation entry (entry type 09) has not been filed. Consistent with CAPE Phase 1, the entries flagged for reconciliation will be limited to unliquidated entries and entries within 80 days of liquidation.
Once the entries flagged for reconciliation are accepted on a CAPE declaration, the trade may file the reconciliation entry. The CAPE process removes the IEEPA duties from the flagged entries prior to the filing of the reconciliation entry, separating the IEEPA duty refund from the calculations on the reconciliation entry. Once the reconciliation entry is filed, CBP will assume that all the CAPE declarations associated with the reconciled entries were filed and accepted. Once a reconciliation entry is filed, the underlying entries will not be eligible to be filed on a CAPE Declaration in this phase, pursuant to the June 29, 2026, deployment.
Entries Flagged for Reconciliation with Reconciliation on File
Entries flagged for reconciliation with the reconciliation entry already on file are not included in the June 29, 2026CAPE deployment. The CAPE process does not prevent an entry from being reconciled. If the reconciliation filing deadline is close to expiring (e.g., less than 30 days), the trade will need to prioritize the filing of the reconciliation. Entries flagged for reconciliation with a reconciliation entry already on file will be included in a future phase of CAPE development.
As future CAPE enhancements are deployed, CBP will issue Cargo Systems Messaging Service (CSMS) messages providing filing requirements and guidance.
If you encounter any errors in filing an entry summary, contact your CBP client representative or the ACE Help Desk.
Questions regarding this message should be directed to CBP at IEEPAREFUNDS@cbp.dhs.gov.
Related Message Number(s): 68315804, 68340863, 68396594
………………………………………………………………………………………………………………………………………………………………………………………………………………………………………….

………………………………………………………………………………………………………………………………………………………………………………………………………………………………………….
Ongoing Space Issues For Shipment Ex India Market
………………………………………………………………………………………………………………………………………………………………………………………………………………………………………….
BOC would like to share an important update on the current shipping situation from India. Over the past few weeks, we have witnessed significant capacity tightening, and we believe it is essential to keep you fully informed.
The Root Cause: Geopolitical Disruption, Not Just Demand Shifts
The ongoing geopolitical conflicts (particularly the Red Sea crisis and related route diversions) have become the major trigger, creating a ripple effect across global shipping networks. Here’s how it’s impacting India-export cargo:
- Vessel rerouting and extended voyage times – Due to security risks in the Red Sea / Gulf of Aden region, a large number of vessels are being forced to take the longer route around the Cape of Good Hope. This has significantly increased round-trip voyage durations, effectively absorbing a substantial portion of global fleet capacity, and thrown scheduling into disarray.
- Service cancellations and blank sailings – To manage this disruption, carriers have been forced to suspend or adjust long-established India-US services (e.g., the 12-year-old Indus Express), and multiple blank sailings are already scheduled through mid-July.
- Resulting impact on rates and space – The combined effect of reduced effective capacity and higher operational costs has pushed spot rates dramatically higher, with further GRI and PSS announcements already confirmed for early July.
Our action plan to secure your shipments:
- Extended booking forecast – We strongly recommend sharing shipping forecast for the next 6–8 weeks, so we can pre-block vessel space with carriers as early as possible.
- Authorization to confirm bookings – Given that available space is now often gone within hours of release, we kindly request your authorization to go ahead and confirm bookings whenever we find available space, without seeking separate prior approval for each shipment. This will save critical turnaround time and ensure you aren’t left without a vessel when your cargo is ready. Please let us know if we have your green light to proceed this way – or if you prefer us to seek case-by-case confirmation (with the understanding that we may lose some space during the back-and-forth).
………………………………………………………………………………………………………………………………………………………………………………………………………………………………………….

………………………………………………………………………………………………………………………………………………………………………………………………………………………………………….
Importer Security Filing Facts and Details
………………………………………………………………………………………………………………………………………………………………………………………………………………………………………….
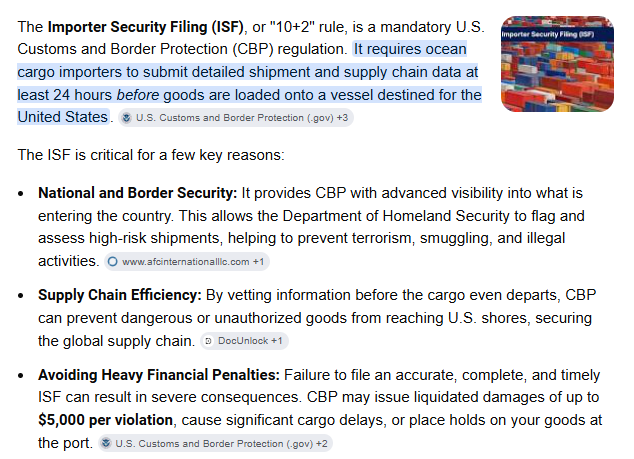
ISF (Importer Security Filing) is just as important as ever!
https://www.cbp.gov/border-security/ports-entry/cargo-security/importer-security-filing-102
Key points:
- ISF must be filed prior to departure of the vessel at origin.
- Importer of Record is the party responsible for providing and filing the required information, and the party CBP assesses penalties to for late, incorrect or incomplete ISF filing.
What is an Importer Security Filing?
Before merchandise arriving by vessel can be imported into the United States, the “Importer Security Filing (ISF) Importer,” or their agent (e.g., licensed customs broker), must electronically submit certain advance cargo information to CBP in the form of an Importer Security Filing.
This requirement only applies to cargo arriving in the United States by ocean vessel; it does not apply to cargo arriving by other modes of transportation.
Information required to be submitted includes Seller name, Buyer name, Importer of Record, Consignee name, Manufacturer (or Supplier), Ship to party, Country of origin of the product, HTS number, Container stuffing location and Consolidator
Who is Responsible for the Filing?
The ISF Importer (the US Importer of Record) (or their agent) is required to submit the Importer Security Filing. The ISF Importer is the party causing the goods to arrive within the limits of a port in the United States by vessel. Typically, the ISF Importer is the goods’ owner, purchaser, consignee, or agent
such as a licensed customs broker.
Where does the information come from?
The ISF is a ‘partnership’ between Shippers, Forwarders, Consolidators and Importers. Different information is supplied by different parties. But at the end of the day, the Importer is the one ultimately responsible for providing the required data to US Customs.
Importers either need to provide their US Customs broker with all the data to file ISF, or they need to rely on their shippers to provide the information to the US Customs broker. But the US Importer is still responsible.
Penalties
CBP may issue liquidated damages of $5,000 per violation for the submission of an inaccurate, incomplete or untimely filing.
If goods for which an ISF has not been filed arrive in the U.S.:
- CBP may withhold the release or transfer of the cargo;
- CBP may refuse to grant a permit to unlade for the merchandise; and if such cargo is unladen without permission, it may be subject to seizure.
Additionally, noncompliant cargo could be subject to “do not load” orders at origin or further inspection on arrival.
………………………………………………………………………………………………………………………………………………………………………………………………………………………………………….

………………………………………………………………………………………………………………………………………………………………………………………………………………………………………….
ACE Portal Webinar: How to Set Up and Manage an
ACE Portal Account
………………………………………………………………………………………………………………………………………………………………………………………………………………………………………….
Cargo Systems Messaging Service
CSMS # 68952537 – ACE Portal Webinar: How to Set Up and Manage an
ACE Portal Account on Wednesday, June 17, 2026, at 11:00 a.m. ET
U.S. Customs and Border Protection’s (CBP) Office of Trade is hosting a webinar on Wednesday, June 17, 2026, at 11:00 a.m. ET titled How to Set Up and Manage an ACE Portal Account. This webinar will provide an overview of how to set up an ACE Portal Account, along with information on new webforms and Trade Account Owner (TAO) functionality. We will also address common questions and solutions and provide an overview of recent portal improvements.
To register for this free webinar, click here. All registrants will receive the access link for the webinar the day before the event, but entry into the webinar is on a first-come, first-served basis as seats are limited. After the live event, this and other previously recorded webinars will be available for replay at Trade Outreach Webinars.
If you have any questions about this webinar, please contact OTRwebinars@cbp.dhs.gov.
………………………………………………………………………………………………………………………………………………………………………………………………………………………………………….

………………………………………………………………………………………………………………………………………………………………………………………………………………………………………….
Changes to Importer of Record Requirements
(Especially Foreign Importers)
………………………………………………………………………………………………………………………………………………………………………………………………………………………………………….
From: whitehouse.gov
DIRECTING COMPREHENSIVE CUSTOMS REFORM: Today, President Donald J. Trump signed an Executive Order that will strengthen the enforcement of U.S. customs laws through comprehensive reform.
- The Order directs the Department of Homeland Security (DHS) and U.S. Customs and Border Protection (CBP) to strengthen several requirements for importers of record (IORs). Examples include:
- increasing bonding requirements and requiring IORs to maintain at all times a minimum level of tangible domestic assets, bonding, or both;
- subjecting foreign IORs to heightened requirements for formal entry;
- authorizing only U.S. IORs to file informal entry;
- imposing a “good standing” requirement on all IORs; and
- increasing vetting procedures for all individuals and entities that conduct activities directly related to the importation of goods.
- The Order directs DHS and CBP to establish various disclosure and certification requirements designed to combat duty evasion and noncompliance with supply chain rules.
- The Order directs DHS and CBP to increase enforcement of existing customs laws, including by establishing a 50% minimum penalty floor limiting CBP’s discretion to reduce the assessed penalties on importers who violate our customs laws.
- The Order directs DHS to enhance the seizure and disposal of non-compliant imports, including by reducing regulatory burdens to voluntary abandonment and authorizing third-party disposal.
- The Order directs DHS to enhance transparency in customs, including by publishing annual transparency reports.
- The Order directs DHS to propose legislation to strengthen customs enforcement.
PROMOTING ECONOMIC STRENGTH AND NATIONAL SECURITY BY COMBATTING CUSTOMS FRAUD: President Trump recognizes the critical role of customs enforcement to our national security and that action is needed to address longstanding issues with the existing regulatory environment.
- Customs enforcement is essential to the national security and economy of the United States. For example, it prevents the importation of unlawful and dangerous goods, and it ensures that IORs are accountable for duties owed and comply with numerous federal laws, including laws governing forced labor and product safety.
- Customs reform is long overdue. Systemic inefficiencies, loopholes, insufficient enforcement mechanisms, and outdated processes have created opportunities for malign actors to evade federal law.
- The Order addresses these longstanding concerns through comprehensive reform focused on protecting national security, promoting lawful trade, ensuring the timely collection of duties, modernizing systems and processes, bolstering compliance mechanisms, and protecting Americans and the domestic economy.
- The Order also brings U.S. customs policy and practice in line with many of our trading partners. For example, the current practice of most foreign countries is to either prohibit foreign entities or persons from serving as the IOR or generally require that foreign importers partner with verified domestic parties. This practice promotes compliance and accountability while reducing barriers to enforcement.
- The reforms directed in the Order will not take effect immediately. In general, DHS and CBP will engage with relevant stakeholders through the standard rulemaking process, meaning affected parties will have a meaningful opportunity to adjust operations, if needed.
BUILDING ON A RECORD OF PUTTING AMERICA FIRST IN TRADE: President Trump is taking action to restore integrity to our customs system, crack down on duty evasion, and ensure that foreign importers play by the rules.
- On Day One, as part of his America First Trade Policy, President Trump directed his Administration to take a number of steps to ensure that duties are collected and tariffs are not evaded.
- President Trump suspended the de minimis loophole — long exploited by foreign shippers to flood American markets with cheap, duty-free goods and funnel illicit fentanyl into the country.
- A number of President Trump’s Agreements on Reciprocal Trade include commitments to cooperate on combatting duty evasion.
- The President signed into law the One Big Beautiful Bill Act, which permanently repealed the statutory basis for the de minimis exemption worldwide, effective July 1, 2027.
………………………………………………………………………………………………………………………………………………………………………………………………………………………………………….